Wait what? Track the coffee consumption? What's going on here??
How it began...
A few days back I started setting up a Grafana Dashboard for our main SBC-Cluster to visualize the data that we collect with Homer7. I show the amount of calls per day and the concurrent calls for this day to show the load of our system... or to show off with the load we have ;)
A few hours after I pushed this to our office TV (we have a big TV in the Kitchen driven by PiSignage) a collegue said it would be funny to show our coffee consumption. That moment my brain started thinkg about that. I researched severy solutions and came to the same, that I use for my washing mashine at home: metering the power consumption.
What did I use?
Hardware
At home I use Z-Wave hardware. Since I wanted to keep it as simple as possible, I used a WiFi enabled solution for the office:
Software
I needed some kind of solution to interprete and store the data. I figured out a stack consiting of the following will be the best:
How does all that work together?
![]()
- The coffee mashine is hooked up the the Smart Plug.
- That plug reports it's state via mqtt every 10 seconds.
- Node-RED receives the mqtt telegrams and checks the data.
- If the power-consumptions is greater than 500 Watts, a Web Request is striggered to a PHP script
- The PHP script write a new entry to a SQLite DB.
- My Grafana Dashboard pulls the data using the Simple JSON Plugin from the same PHP script.
- Using Grafana Renderer I render an image of the dashboard and that is presented on the TV using PiSignage.
How does it look like?
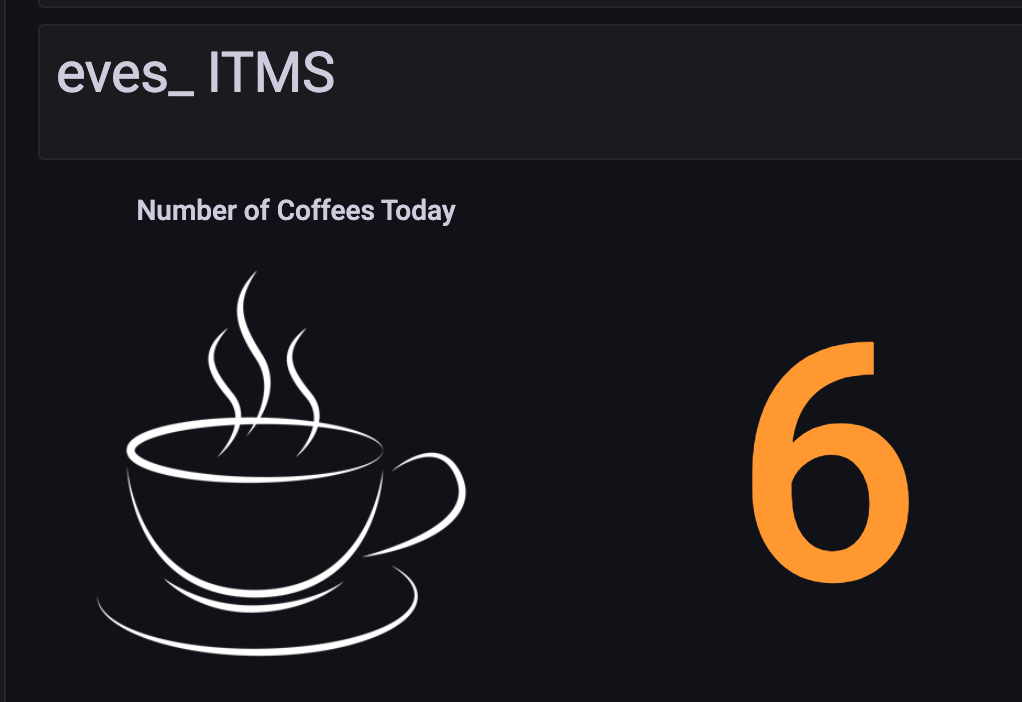
That's the Panel from the Dashboard showing the coffee consumption: (Sorry for the number, I was alone at the office today)
If you are interested in the source code used for this, just give me a DM on Twitter.